
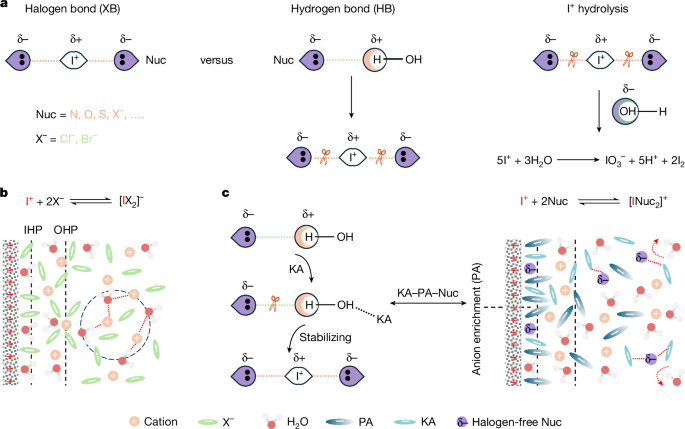
All chemicals were used as received without further purification unless otherwise stated. The manufacturer and purity of each material are specified at its first occurrence in Methods and are not repeated thereafter unless a different source or purity was used.Preparation of electrolytesThe KA–PA–Nuc electrolytes were prepared by dissolving KA, PA and Nuc into deionized water at room temperature. For aqueous Zn–I2 batteries, KA and PA were 1.5 M ZnSO4 (>99%, Sigma-Aldrich) and 0.5 M Zn (CH3COO)2 (>98%, Sigma-Aldrich), respectively. To demonstrate the broad applicability of the KA–PA–Nuc framework, various Nuc were used, including 2 M urea (>99.5%, Sigma-Aldrich), 2 M acetamide (>99%, Sigma-Aldrich), 0.2 M pyridine (>99%, Sigma-Aldrich) or 0.4 M nicotinamide (>99.5%, Sigma-Aldrich). To explore the role of PAs, a baseline electrolyte containing 1.5 M ZnSO4 and 0.4 M nicotinamide was prepared. Zn(CH3COO)2, Zn(CF3COO)2 (purity not specified, Sigma-Aldrich) or Zn(CF3SO3)2 (>98%, Sigma-Aldrich) was then added at a concentration of 0.5 M to obtain electrolytes containing different PAs. To evaluate the role of KAs, a baseline electrolyte containing 0.5 M Zn(CH3COO)2 and 0.4 M nicotinamide was prepared. ZnSO4, Zn(NO3)2 (>99%, Sigma-Aldrich), Zn(CF3SO3)2 or Zn(ClO4)2 (purity not specified, Sigma-Aldrich) was then added at a concentration of 1.5 M for comparative analysis. To compare electrolytes performance under a standardized ionic strength condition, the ionic strength of each electrolyte was calculated according to the equation:$${I}_{i}=frac{1}{2}mathop{sum }limits_{i=1}^{n}{C}_{i}{Z}_{i}^{2}$$where Ci and Zi represent the molar concentration and charge number of ion i, respectively. For aqueous Al–I2 batteries, the KA–PA–Nuc electrolyte was prepared by dissolving 1.5 M Al2(SO4)3 (>99%, Sigma-Aldrich), 0.5 Mg (CH3COO)2 (>99%, Sigma-Aldrich) and 0.5 M nicotinamide into deionized water.Preparation of electrodesIodine-activated carbon (I2–AC) composites were prepared using an evaporation–adsorption method. In brief, 0.5 g iodine (>99.5%, Thermo Scientific Acros) and 0.5 g activated carbon (AC; YP-80F, purity not specified, Kuraray) were manually ground in an agate mortar with a pestle for 10 min under ambient conditions. The resulting mixture was sealed in a Teflon reactor and heated at 120 °C for 6 h. For the preparation of iodine positive electrodes using titanium (80 mesh, >99.5%, Hebei Conway Metal Products) or stainless steel mesh (80 mesh, 316L, Hebei Conway Metal Products) as the current collector, I2–AC, polytetrafluoroethylene (PTFE, 60 wt% dispersion H2O, Sigma-Aldrich) and Super P (purity not specified, Canrd) were combined at a mass ratio of 8:1:1. For each batch, 40 mg I2–AC, 5 mg Super P and 5 mg PTFE (calculated on a dry-PTFE basis) were manually mixed with deionized water using an agate mortar and pestle under ambient conditions. The resulting mixture was rolled into a self-standing film using a roller press (Etelux) and subsequently dried in an oven at 60 °C for 3 h in air. The areal iodine loading was controlled by adjusting the thickness of the composite film. The dried film was then pressed onto the titanium or stainless steel mesh using the roller press. The resulting electrodes were punched into 12 mm disks using a manual disk punch (T07, Hefei Kejing Material Technology).For iodine positive electrodes using carbon paper (TGP-H-060, Toray) as the current collector, I2–AC, polyvinylidene fluoride (PVDF, weight-average molecular weight, Mw ≈ 534,000 g mol−1 by gel permeation chromatography, powder, Sigma-Aldrich) and Super P were combined at a mass ratio of 8:1:1. For each batch, 160 mg I2–AC, 20 mg PVDF and 20 mg Super P were manually mixed with N-methyl-2-pyrrolidone (>99.5%, Thermo Scientific Acros) using an agate mortar and pestle in ambient conditions. The resulting slurry was manually and uniformly spread onto the carbon paper using a laboratory spatula. The coated electrodes were dried in a vacuum oven at 60 °C for 8 h and subsequently cut into 12-mm disks using the manual disk punch. Commercial Zn foils (70 µm, >99.99%, Qinghe Haoxuan Metal Materials) were used as negative electrodes as received.To assess the potential of the KA–PA–Nuc electrolyte framework in multi-electron aqueous Al–I2 batteries, a Ag/AgCl electrode in saturated KCl (Beijing Jingke Instrument Science Instrument) was used as the reference, and AC electrodes were prepared as the counter electrode. The measured potentials are reported directly versus the Ag/AgCl reference electrode. For the preparation of AC electrodes, AC, PTFE and Super P were combined at a mass ratio of 8:1:1. For each batch, 160 mg AC, 20 mg Super P and 20 mg PTFE (calculated on a dry-PTFE basis) were manually mixed with deionized water using an agate mortar and pestle at ambient conditions. The resulting mixture was rolled into a self-standing film using the roller press and subsequently dried in an oven at 60 °C for 3 h in air. The dried film was then pressed onto titanium mesh using the roller press. By adjusting the electrode thickness, the capacity of the AC electrode was controlled to be much higher than that of the iodine working electrode, ensuring its capability as the counter electrode for evaluating the electrochemical performance of the KA–PA–Nuc electrolyte. To further validate the applicability of the KA–PA–Nuc electrolyte framework in multi-electron aqueous Al–I2 batteries, Al–Zn alloys were fabricated as negative electrodes following a previous study43. In brief, symmetric cells were assembled using Zn foils (70 µm, 16 mm in diameter) as electrodes and 2 M Al (CF3SO3)3 (>99.9%, Sigma-Aldrich) as the electrolyte. During charging, Al3+ in the electrolyte deposited on and reacted with the metal Zn substrate, forming the Zn-supported Al–Zn alloys.Synthesis of halogen-bond complexesHalogen-bond complexes were synthesized via a cation-exchange reaction using corresponding silver analogues, following a previously reported procedure with some modifications44. All operations were carried out under a standard Schlenk line. In a typical synthesis, 0.94 mmol of the corresponding silver salt (Ag2SO4, >99%, Sigma-Aldrich; AgCH3COO, >99%, Sigma-Aldrich; AgCF3COO, >98%, Sigma-Aldrich; AgCF3SO3, >99%, Sigma-Aldrich; AgNO3, >99%, Sigma-Aldrich; or AgClO4, >97%, Sigma-Aldrich) was added to a 20-ml vial equipped with a stir bar. The vial was sealed with a rubber septum and evacuated. Subsequently, 6.0 ml dry CH2Cl2 (purity not specified, VWR Chemicals) and 1.90 mmol pyridine (3.80 mmol for Ag2SO4) were added at room temperature under a nitrogen atmosphere. The mixture was stirred for 10 min to form the Ag(I)–pyridine bis-coordination complex. Next, 2.00 mmol of iodine (4.00 mmol for Ag2SO4) was added, and the reaction was allowed to proceed for an additional 20 min under continuous stirring. The supernatant was then carefully transferred to another vial via cannula filtration, followed by the addition of 15 ml dry n-hexane (>99%, Macron Fine Chemicals) to induce precipitation of the halogen-bond complex. The mixture was stored at −20 °C overnight to complete precipitation. Afterwards, the supernatant was removed using a syringe, and the resulting solid was washed with 20 ml dry n-hexane to remove any residual I2. Finally, the product was dried under vacuum on the Schlenk line.Materials characterizationsIn situ ATR-IR measurementsIn situ ATR-IR spectra were recorded by a Thermo Scientific Nicolet iS50 spectrometer equipped with a liquid nitrogen-cooled MCT-A detector. Gold-coated silicon plates were used as working electrodes, with Zn foils (70 µm, 10 mm in diameter) and glass fibre (GF/D, 12 mm in diameter, Whatman) used as reference electrodes and separators, respectively. To assess the critical role of the PA in the interfacial environment, 1.5 M KA electrolyte was maintained as the baseline, and 0.5 M Zn(CH3COO)2, 0.5 M Zn(CF3COO)2 or 0.5 M Zn(CF3SO3)2 was separately added. An electrolyte volume of 500 μl was used for each measurement. During tests, the assembled batteries were connected to a Gamry Interface 1000 potentiostat to run a cyclic voltammetry programme at a scan rate of 0.2 mV s−1 for a full charge and discharge cycle. All spectra were collected at a resolution of 4 cm−1, with 50 scans per measurement. Measurements were performed at an ambient laboratory temperature of approximately 18–25 °C.In situ Raman measurementsRaman spectra were recorded using a Bruker Senterra II Raman spectrometer with a 532-nm excitation wavelength. The in situ Zn–I2 cell comprised an iodine positive electrode (12 mm in diameter, iodine mass loading 2.2 mg cm−2), a Zn negative electrode (70 µm, 12 mm in diameter) and a glass fibre (GF/D, 12 mm in diameter). An electrolyte volume of 200 μl was used. Raman spectra were collected during GCD cycling using an external Gamry Interface 1000 potentiostat. Measurements were performed at an ambient laboratory temperature of approximately 18–25 °C.FTIR spectra of various electrolytes were obtained using an ATR-FTIR spectrometer (BRUKER, Platinum-ATR). Scanning electron microscopy characterization of electrodes was performed using a JEOL 7600 microscope. Ultraviolet–visible measurements were conducted on a Shimadzu UV-3600i Plus spectrophotometer. For in situ ultraviolet–visible measurements, a two-electrode Zn–I2 cuvette cell was connected to a Neware battery test system for GCD cycling. NMR analyses, including 1H, 13C and 1H–15N HMBC spectra, were carried out on a Bruker NMR instrument (Avance Neo 500). 15N spectra were collected using a Bruker NMR instrument (Avance Neo 700). Deuterium oxide (>99.9%, Fluorochem) was used as the solvent for electrolyte characterization, and dideuteromethylenechloride (>99.9%, Sigma-Aldrich) was used as the solvent for characterizing halogen-bond complexes. Micro-computed-tomography imaging was conducted using a Zeiss Xradia 620 Versa system with a ×4 objective, operating at a tube voltage of 80 kV and an exposure time of 8 s, achieving a voxel resolution of 0.8 μm. For each sample, a disk with a diameter of 2 mm was prepared to balance X-ray attenuation and representative sampling volume. The acquired computed-tomography datasets were subsequently processed and analysed using Avizo software.Electrochemical measurementsCoin-cell and Swagelok-cell configurationsElectrochemical studies of halogen-free electrolytes were performed using CR2025 coin cells, whereas those of halogen-containing electrolytes were performed using Swagelok cells. For CR2025 Zn–I2 coin cells, the iodine positive electrode, Zn negative electrode (70 µm) and separator (GF/D) had diameters of 12 mm, 16 mm and 19 mm, respectively. For Swagelok Zn–I2 cells, corresponding electrodes and separators had the same diameter of 12 mm. For CR2025 Al–I2 coin cells, the iodine positive electrode had a diameter of 12 mm, the Al–Zn alloy negative electrode had a diameter of 16 mm, and a GF/D separator with a diameter of 19 mm was used. An electrolyte volume of 100 μl was used for each cell. Coin cells were mechanically crimped at 50 kg cm−2 using a hydraulic crimping machine (MSK-110, Hefei Kejing Material Technology) during assembly. Swagelok cells were manually tightened during assembly.Pouch-cell configurationFor the 1.1-Ah pouch cell, 2 double-side coated iodine positive electrodes (10 × 15 cm), and 3 Zn negative electrodes (70 µm, 10 × 15 cm) were stacked alternately. The areal iodine loading of positive electrodes is controlled at 10 mg cm−2. Four glass fibre separators (GF/D, 10.1 × 15.1 cm) were utilized, and 1.5 ml electrolyte was added to each separator. The electrolyte consisted of 1.5 M ZnSO4, 0.5 M Zn(CH3COO)2 and 0.4 M nicotinamide. Titanium foils were connected to electrodes as tabs. After lamination, the assembled battery was encapsulated in an aluminium–plastic film and mechanically constrained using a customized model during electrochemical measurements. The applied pressure was not specifically quantified.Other electrochemical testsGCD tests were conducted using a Neware battery test system in a room maintained at an ambient temperature of approximately 25–28 °C. All other electrochemical measurements described below were performed at an ambient laboratory temperature of approximately 18–25 °C. Cyclic voltammetry, linear sweep voltammetry and EIS measurements were performed using a Biologic VMP-3 potentiostat. For the electrochemical stability window analysis, linear sweep voltammetry measurements were performed using a three-electrode configuration consisting of a titanium mesh working electrode (1 × 2 cm), an AC counter electrode (1 × 2 cm) and an Ag/AgCl reference electrode at a scan rate of 2 mV s−1. The measured current was normalized to an exposed geometric area of 1 cm², and the potentials are reported directly versus Ag/AgCl. The polarization measurements were performed in asymmetric Zn–Ti CR2025 coin cells using Zn foil (16 mm in diameter), titanium foil (12 mm in diameter) and a glass fibre separator (19 mm in diameter) at a scan rate of 5 mV s−1. The measured current was normalized to the geometric area of the titanium electrode. For in situ EIS tests, a thin Zn wire was inserted into the coin cell as an additional reference electrode to establish a three-electrode configuration. This reference electrode was placed between the positive electrode and negative electrode, separated by two layers of separators (GF/A, Whatman). For measurements of the individual iodine positive electrode, the potential is reported versus the Zn reference electrode as potential (V versus Zn/Zn²+), whereas the full-cell and Zn negative electrode responses are reported as voltage (V) owing to the voltage was applied on full cell. For peak assignment, the assembled cells were connected to a Biologic VMP-3 potentiostat to perform staircase potentio EIS with a potential range of approximately 0.6–1.8 V. For rate-step identification, the assembled cells simultaneously connected to a Biologic VMP-3 potentiostat and a Neware battery test system to conduct potentio EIS and GCD cycling, respectively. All Nyquist plots were fitted using EC-Lab software based on the equivalent circuit (R1 + Q2/R2 + Q3/R3 + W4). DRT data were calculated from EIS data using MatlabR2019 with the DRT tool developed by Francesco Ciucci’s research group. The differential capacitance was calculated using the following equation:$$C=-{(omega {Z}_{mathrm{im}})}^{-1}$$where C is the differential capacitance, ω is the angular frequency and Zim is the imaginary component of the impedance. In this work, a specific frequency of 1,000 Hz was used. Measurements were performed in asymmetric Zn–Ti cells assembled in CR2025 coin-cell configuration, using Zn foil (16 mm in diameter) and titanium foil (12 mm in diameter) as the two electrodes and a glass fibre separator (19 mm in diameter). The potential was varied from 1.0 V to 1.7 V versus Zn/Zn2+. No ohmic-drop (iR) correction was applied to the potentials or voltages reported in this work.Theoretical calculationsClassical molecular-dynamics simulationsAll molecular-dynamics simulations were performed using the LAMMPS package45 to investigate the bulk solvation structure of various aqueous electrolytes. The initial configurations were constructed using Packmol46, which randomly packed electrolyte components into a periodic cubic box according to the target molar ratios, ensuring no initial atomic overlaps. The simulation cell was then relaxed by energy minimization before subsequent equilibration. Force-field parameters for organic molecules were taken from the OPLS-AA family47,48, whereas others were adopted from validated aqueous zinc salt parameter sets in the literature. To partially account for polarization effects in concentrated electrolytes, the atomic charges were uniformly scaled (scaling factor 0.8)49. Interaction of water was represented by TIP3P50, and all X–H bonds were constrained using the SHAKE algorithm51. Each system was first energy-minimized and equilibrated in the isothermal–isobaric ensemble (300 K, 1 atm) using a Nosé–Hoover thermostat until both the density and potential energy were stable. Subsequently, production runs were performed in the canonical ensemble for 5 ns (5,000 ps) with a 1-fs integration step to ensure complete equilibration while avoiding structural drift.Structural and hydrogen-bond analysisRadial distribution functions gij(r) were computed to analyse ion pairing and solvation structure. Coordination numbers were obtained by integrating gij(r) up to their first minimum. Both radial distribution functions and hydrogen bonds were identified using the hydrogen-bond analysis tools implemented in VMD52. Average hydrogen-bond numbers and distributions were determined over the equilibrated trajectories to characterize the reorganization of the hydrogen-bond network by different anions.Electric-field simulationsTo probe field-induced ion and molecular redistribution, an additional set of simulations was conducted in the canonical ensemble with a uniform static electric field applied along the z axis. The field strength corresponded to the experimentally estimated potential gradient.Halogen-bond analysisDensity-functional-theory calculations were performed using the Gaussian16 program package, using the M06-2X exchange-correlation functional53. Geometry optimizations were conducted using a mixed basis-set approach: the 6-311+G(d,p) basis set was applied to all elements excluding iodine54. Iodine was described using an effective core potential from the Stuttgart/Dresden group55. Solvent effects were accounted for using the polarizable continuum model, with water selected as the solvent56.
نشر لأول مرة على: www.nature.com
تاريخ النشر: 2026-11-11 03:00:00
الكاتب: Ruwei Chen
تنويه من موقع “wakalanews”:
تم جلب هذا المحتوى بشكل آلي من المصدر:
www.nature.com
بتاريخ: 2026-11-11 03:00:00.
الآراء والمعلومات الواردة في هذا المقال لا تعبر بالضرورة عن رأي موقع “wakalanews”، والمسؤولية الكاملة تقع على عاتق المصدر الأصلي.
ملاحظة: قد يتم استخدام الترجمة الآلية في بعض الأحيان لتوفير هذا المحتوى.
wakalanews.com — متابعة الخبر