Human participants
Collection and analyses of breast cancer tissue samples and matching blood samples were approved by the Israeli Ministry of Health Ethics Committees (Helsinki applications KMC-0028-22), followed by approval of the Weizmann Institutional Review Board (IRB, 2314-3).
The breast cancer samples for histone PTM mass-spectrometry-based analysis, which comprise 21 tumours, were obtained from patients undergoing surgery at the European Institute of Oncology and are part of a study approved by the institute’s Ethical Committee (study UID 2550).
Plasma samples and data for luminal breast cancer patients were obtained from Mayo Clinic (IRB approval number 23-011311). Collection of plasma samples from breast cancer patients treated at the Sheba Medical Center was approved by the Institutional Review Board (IRB approval 7509-09). Plasma samples from healthy individuals were obtained from the Weizmann Institute of Science (IRB approval number 1850-1).
All studies were performed in accordance with the relevant guidelines and regulations, and informed consent was obtained from all participants. No direct identifying participant information is reported in this study. Participants’ information is detailed in Supplementary Tables 2 and 6. No statistical methods were used to predetermine sample sizes. No randomization or blinding was performed in the collection, processing, or analysis of human samples.
PDX models
All animal studies were approved by the Weizmann Institute’s Institutional Animal Care and Use Committee (IACUC), and they were performed in accordance with Israeli law. Mice were housed and handled in a pathogen-free, temperature-controlled (22 °C ± 1 °C) facility on a 12-h light–dark cycle. Animals were fed a regular chow diet (2018 Teklad Global 18% protein rodent diet) and given ad libitum access to food and water.
The TM00112 (PDX-1) and TM00386 (PDX-2) models were purchased from the Jackson Laboratory and implanted in 10-week-old female NSG mice (Jackson Laboratory). In brief, following euthanasia, tumours were removed from donor mice and cut into small fragments. A small pouch was made in the lower back of each mouse, and one fragment was inserted into the pouch. The wound was closed using a surgical clip. Clips were removed 4–5 days after surgery. Tumours were measured twice a week with a caliper, and body weight was measured once a week. The IACUC-approved maximum tumour size was 1,000 mm3. Mice were euthanized when tumours reached approximately 500 mm3, and tumours were collected for analyses. No statistical method was used to predetermine sample sizes. Animals were not randomized, and investigators were not blinded during the experiments.
Cell culture
MCF7 and MDA-MB-468 cell lines were obtained from the Tissue Culture Cell repository at the Weizmann Institute of Science. HCC70, HCC1937 and SUM149 cell lines were provided by I. Ben-Porath. HCC70 and HCC1937 cells were cultured in RPMI-1640 supplemented with 10% FBS, 1% L-glutamine and 1% penicillin–streptomycin. SUM149 cells were maintained in Ham’s F-12 medium supplemented with 5% FBS, 1 µg ml–1 hydrocortisone (Sigma-Aldrich, H0888), 0.5 µg ml–1 insulin (Sigma-Aldrich, I5500), L-glutamine and penicillin–streptomycin. MDA-MB-468 and MCF7 cells were cultured in DMEM (Thermo Fisher Scientific, 41965-039) supplemented with 10% FBS (Sigma-Aldrich, F7524), 1% L-glutamine (Sartorius, 03-020-1B) and 1% penicillin–streptomycin (Corning, 30-002-CI). All cells were maintained at 37 °C in a humidified atmosphere containing 5% CO2.
Single-cell-derived MCF7 clones and matching parental MCF7 cells were either provided by U. Ben-David89 or generated in-house by single-cell sorting into 96-well plates using a Sony SH800S cell sorter (Sony Biotechnology) and expanded for approximately 4 months before experiments.
Cell lines were not independently authenticated but were routinely tested for mycoplasma contamination and were negative.
Tumour sample selection for different applications
Owing to the limited number of dissociated cells available from each tumour sample provided for research, we were unable to profile identical samples using all the different methods described in the paper. The single-cell CyTOF-based epigenetic analysis of human tumours was the priority for each tumour (besides tumour 23, which was used for WGBS and not profiled by CyTOF). For tumour 18, both WGBS and snCUT&Tag were performed owing to the high availability of tumour cells. For the remaining samples, we did not have sufficient cells to perform both methodologies. Notably, although the additional analyses were not conducted on identical samples, each was performed on three independent tumour samples, which ensured the reproducibility of the conclusions from each approach. The focus of the analysis was on identifying common patterns in tumours, rather than comparing between tumours and patients.
Clinicopathological and molecular data of tumour samples
Patient and tumour information was extracted from pathological reports. To quantify ER positivity, formalin-fixed paraffin-embedded (FFPE) tumour blocks prepared alongside sample collection for CyTOF analysis were retrieved, sectioned and stained for ER by IHC. Slides were scanned, and digital images containing DAB signals were analysed using QuPath software90. Tissue regions were first segmented using a pixel classifier to identify areas containing tissue (average channels < 245, sigma = 2, at 8.4 μm resolution). In these regions, epithelial and stromal compartments were segmented using a supervised pixel classifier, with a minimum object size of 1,000 µm2 and a minimum hole size of 5,000 µm2. The classifier was trained on representative regions from multiple slides using a multilayer perceptron (ANN_MLP) model implemented in QuPath, based on haematoxylin and DAB channels at 2.1 µm resolution and multiscale neighbourhood features (scales 1, 2, 4, 8 and 12). Cell nuclei in epithelial regions were segmented using Cellpose-SAM91. For each nucleus, the median DAB intensity was quantified. The distribution of nuclear DAB intensities was computed for each tumour sample and a per-sample thresholding was used to account for inter-slide staining variability. For each tumour, a kernel density estimate of the median nuclear DAB intensity was computed, constrained to the observed intensity range. Local maxima and minima of the density function were identified, and the threshold separating ER-negative and ER-positive nuclei was defined as the lowest local minimum between the two most prominent density peaks. Tumour-specific thresholds derived using this approach were applied to classify nuclei as ER-positive or ER-negative, and the percentage of ER-positive cells was calculated for each sample.
Mutation calling in tumour samples
DNA was extracted from FFPE blocks using a RecoverAll Total Nucleic Acid Isolation kit (Thermo Fisher Scientific) and stored at −20 °C. FFPE blocks were reviewed and annotated for tumour cellularity by a certified pathologist, with a minimum accepted tumour cellularity threshold of 20%. DNA concentrations were quantified using a Qubit 3 fluorometer using a dsDNA HS Assay kit (Thermo Fisher Scientific).
Libraries were prepared using a TruSight Oncology 500 (TSO500) assay (Illumina) according to the manufacturer’s instructions. In brief, 100 ng DNA from each sample was sheared using a Covaris M220 ultrasonicator (Covaris). Genomic libraries were prepared using a Hamilton Microlab STAR system (Hamilton) and sequenced on an Illumina NextSeq550 instrument with a High Output kit v.2.5 (300 cycles). Initial analysis was performed using DRAGEN TruSight Oncology 500 analysis software (v.2.6.2, Illumina).
Variants were annotated and classified according to AMP guidelines into tiers IA, IB, IIC, IID, III and IV92. Variants classified as tier IV, synonymous, non-coding or having no established biological impact were excluded using Velsera Clinical Genomics Workspace (CGW). Remaining variants were manually reviewed using in silico prediction tools (REVEL, CADD and SpliceAI) together with annotations from Franklin (Genoox), UCSC Genome Browser and Velsera CGW. Variants were reported only when sequencing coverage exceeded 100× and the variant allele frequency was >1%.
Epigenetic-focused CyTOF analysis of freshly isolated breast tumours, PDX models and breast cancer cell lines
CyTOF antibody panel
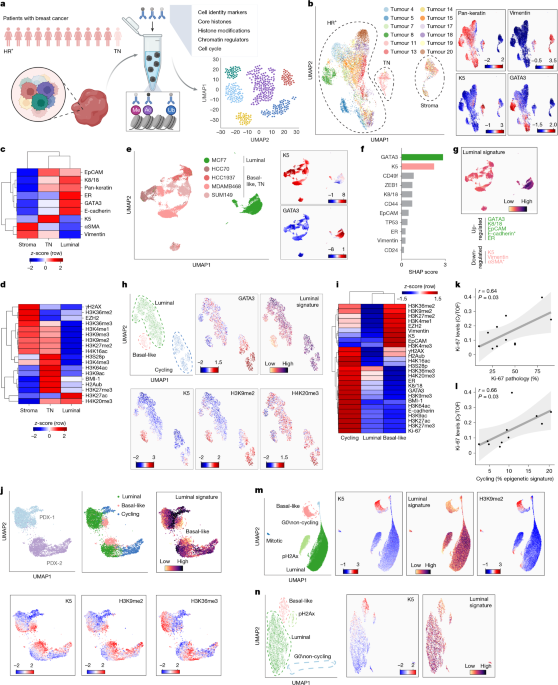
The antibody panel combined breast-tissue-relevant cell identity markers33,34, histone PTMs spanning diverse chromatin states and the chromatin modifiers EZH2 and BMI-1 (Supplementary Table 1). The chromatin marks analysed were chosen on the basis of availability of highly specific and validated antibodies, and quantification of core histones was used for signal normalization.
Cell dissociation and CyTOF staining
Following surgery, a sample of the tumour tissue was kept in MACS Tissue storage solution (Miltenyi Biotec, 130-100-008), and dissociation into single cells was conducted using a human Tumour Dissociation kit (Miltenyi Biotec, 130-095-929) according to the manufacturer’s protocol. Red blood cells were removed using Red Blood Cell Lysis solution (10x, Miltenyi Biotec, 130-094-183) and CD45+ cells were depleted using human CD45 MicroBeads (Miltenyi Biotec, 130-045-801). The cell suspension was then washed with PBS and either further processed for CyTOF analysis or nuclei were extracted for snCUT&Tag analysis (when the number of cells was suitable). For cell lines, cells were dissociated using Accutase (Sigma-Aldrich, STC-07922) supplemented with DNase I (Merck, 4716728001).
For CyTOF analysis, cells were washed with Maxpar CyTOF PBS (Standard BioTools) and stained with 1.25 μM cisplatin (Standard BioTools) for 1 min. Cisplatin was neutralized with warm 10% FBS–DMEM. Cells were washed with Maxpar Cell Staining buffer (Standard BioTools) and blocked using TruStain FcX, Fc Receptor Blocking solution, human (422301, BioLegend), followed by 30 min of incubation with a cocktail of extracellular antibodies (Supplementary Table 1). For tumour samples, cells were washed with PBS, mildly fixed (1.6% paraformaldehyde (PFA)–PBS) for 30 min and frozen in 10% DMSO–FBS. When the number of cells allowed, aliquots of frozen cells from this step were used for additional applications (flow-cytometry-based sorting or WGBS). For cell lines, samples were directly stained for intracellular markers without mild fixation and freezing.
For intracellular staining and CyTOF measurements, tumour samples were thawed, all samples were washed with staining buffer, fixed and permeabilized using Maxpar nuclear antigen staining buffer set (Standard BioTools) according to the manufacturer’s instructions. For multiplexed samples, barcoding was performed using a Cell-ID 20-Plex Pd Barcoding kit (Standard BioTools). In brief, each sample was resuspended in MaxPar Nuclear Antigen Staining Perm buffer (Standard BioTools) and mixed with freshly thawed barcode reagent. Samples were incubated for 60 min at room temperature with mixing every 15 min, washed twice with Perm buffer and all barcoded samples were combined into a single tube or well. Before antibody staining, cells were blocked using 10% FBS for 10 min and then incubated with the antibody cocktail (Supplementary Table 1) diluted in MaxPar Nuclear Antigen Perm buffer (Standard BioTools) for 30 min at room temperature. Cells were fixed with 4% PFA overnight. On acquisition day, samples were suspended in 4% PFA containing 125 nM Cell-ID Intercalator-Iridium (Standard BioTools), washed twice with staining buffer and twice with Maxpar Cell acquisition solution (201240, Standard BioTools). Samples were suspended in Maxpar Cell acquisition solution supplemented with 10% EQ Four Element Calibration Beads (201078, standard BioTools). Before acquisition on a CyTOF machine, cells were adjusted to about 300,000 cells per ml and filtered through a 35 μm mesh cell strainer. Data were acquired on a CyTOF Helios system (Standard BioTools).
The CyTOF software by Standard BioTools was used for normalization. Several gates were applied using FlowJo software: normalization beads were gated out using the 140Ce channel; live single cells were gated using the cisplatin 195Pt, iridium DNA label in 193Ir, event length and the Gaussian parameters of width, centre, offset and residual channels. De-barcoding was done using CyTOF software93.
Epigenetic CyTOF data analysis
Pre-processing
Overall, 17 different tumour samples were analysed by CyTOF, with 5 samples analysed twice as either technical replicates in different batches to provide anchor information or with different antibody panels for the analysis of an additional cell-cycle marker (pRb). A total of 1,565,881 viable cells were measured (around 30,000–400,000 cells per sample; Supplementary Table 3). The remaining CD45+ cells were removed from the analysis. For PDX analysis, CD45+ cells were removed and only human cells were analysed by maintaining human CD298+ and mouse MHC class I-negative cells.
Batch correction
As samples were measured in batches, anchor samples, identical tumour samples measured in different batches, were used to implement batch-effect correction. Batch effects were corrected using a Q-Q transformation based on the empirical cumulative distribution function (ECDF). This method non-linearly maps quantile values from one anchor sample to corresponding quantiles in another, which effectively aligns their distributions. This transformation was then applied to tumour samples in the first batch.
Notably, as Q-Q plot transformation is inherently restricted to the range of the anchor samples owing to its reliance on interpolation, for values outside this range, linear extrapolation—based on the mean and standard deviation of the samples—can approximate the transformation’s slope and intercept, which provides a reasonable estimate of the nonlinear mapping beyond the observed data range.
The transformation can be approximated by the following equation:
$${x}^{{prime} }={{rm{E}}{rm{C}}{rm{D}}{rm{F}}}_{2}^{-1}({{rm{E}}{rm{C}}{rm{D}}{rm{F}}}_{1}(x))approx {beta }_{1}times x+{beta }_{0}+varepsilon approx left(frac{{sigma }_{2}}{{sigma }_{1}}right)times x+left({mu }_{2}-{mu }_{1}times frac{{sigma }_{2}}{{sigma }_{1}}right)+varepsilon $$
Following batch correction, the full cohort was subsampled to roughly 10,000 cells per sample for subsequent analysis with stroma cells. Following the removal of stroma cells, the cohort was further subsampled to 5,000 cells per sample. Normalization and data scaling were performed on either all tumours as one batch or on individual tumours, as previously described22,23. In brief, cells were gated using the core histones (H3, H3.3 and H4), and the signals for intracellular proteins, including histone PTMs, was subsequently normalized using these core histone values to reduce systematic technical variation:
$${M}^{{ij}}=frac{{M}^{{ij}}}{(1+alpha ,{{rm{H}}}_{3.3}^{i}+beta ,{{rm{H}}}_{4}^{i}+gamma {{rm{H}}}_{3}^{i})}$$
The coefficients were selected to minimize the sum of the variances of the core histones. UMAP representations show a random subset of data points (around 10%) to improve visualization.
Dimensionality reduction and clustering
To analyse the high-dimensional data generated from our CyTOF experiments, we first applied dimensionality reduction using UMAP94. This was followed by clustering with DBSCAN95. Clusters were then joined on the basis of similarity in expression patterns to define the three distinct cellular subpopulations: cycling, luminal and basal-like.
PermCell signature scoring using permutation-calibrated marker program scoring for single-cell data
We quantified, for each cell and each predefined gene signature, whether the set was enriched relative to a competitive null that matches the signature size but samples features from the same cell’s remaining markers. The method returns per-cell z-scores, which were visualized on UMAP embedding.
Detailed computation is as follows:
Let X ∈R(N × G) be the cell-by-feature matrix. For sets (,{mathcal{S}}={{S}_{1},ldots ,{S}_{S}}), each Ss has size m_s ms = |Ss|. Optional signed feature weights w{s,g} are supported (w{s,g} = 0 if g ∉ S_s).
We row-centred per cell to remove global level shifts as follows:
$${X}_{c}=X-1{hat{mu }}^{T},hat{{mu }_{i}}=frac{1}{G}mathop{sum }limits_{g=1}^{G}{X}_{i,g}$$
Signed observed sum (unweighted) as follows:
$${{rm{Obs}}}_{i,s}=sum _{gin {S}_{s}}{X}_{c,i,g}$$
Signed observed sum (weighted) as follows:
$${{rm{Obs}}}_{i,s}=mathop{sum }limits_{g=1}^{G}{w}_{s,g}{X}_{c,i,g}$$
Absolute-magnitude observed sum (unweighted) as follows:
$${{rm{Obs}}}_{i,s}^{{rm{abs}}}=sum _{gin {S}_{s}}|{X}_{c,i,g}|$$
Absolute-magnitude observed sum (weighted) as follows:
$${mathrm{Obs}}_{i,s}^{mathrm{abs}}=mathop{sum }limits_{g=1}^{G}|{w}_{s,g}||{X}_{c,i,g}|$$
For competitive null (size-matched permutations or exact enumeration), for each set s, we formed a pool of competitor genes ({{mathcal{P}}}_{{rm{s}}}). By default we used the complement in the current feature space, ({{mathcal{P}}}_{s}={1,ldots ,G}backslash {S}_{s}) (exclude_set = True), enforcing a competitive null; if the complement was too small we fell back to all features. We then sampled m_s genes without replacement from ({{mathcal{P}}}_{{rm{s}}}) to construct null sums for each cell:
$${{rm{Null}}}_{i,s}^{(b),{rm{abs}}}=sum _{gin {{mathcal{B}}}_{s}^{(b)}}|{X}_{c,i,g}|$$
With b = 1,…,B permutations. When the number of combinations (C(|{{mathcal{P}}}_{s}|,{m}_{s})) was below a threshold (default 5 × 10⁴), we enumerated exactly in streamed chunks. For each cell and set, we estimated the null mean and variance (and analogues for the absolute variant) with numerically stable streaming updates; a small constant (10–6) was added to standard deviations to avoid division by zero.
Per-cell z-scores (signed and absolute) were calculated as follows:
$${Z}_{i,s}=frac{{{rm{obs}}}_{i,s}-hat{{mu }_{i,s}}}{hat{{sigma }_{i,s}}},{Z}_{i,s}^{{rm{abs}}}=frac{{{rm{obs}}}_{i,s}^{{rm{abs}}}-{hat{mu }}_{i,s}^{{rm{abs}}}}{{hat{sigma }}_{i,s}^{{rm{abs}}}}$$
Right-tailed P values (two-sided optional) were calculated as follows:
$${P}_{i,s}=1-Phi ({Z}_{i,s}),{P}_{i,s}^{{rm{abs}}}=1-Phi ({Z}_{i,s}^{{rm{abs}}})$$
To summarize effect size while preserving direction, we defined:
$${Z}_{i,s}^{{rm{d}}{rm{i}}{rm{r}}}={rm{s}}{rm{i}}{rm{g}}{rm{n}}({{rm{o}}{rm{b}}{rm{s}}}_{i,s})times {Z}_{i,s}^{{rm{a}}{rm{b}}{rm{s}}}$$
Thus, Z_dir is large and positive when the set is consistently up (large absolute signal with positive net direction), and large and negative when consistently down.
The framework supports signed feature weights w_{s,g} ∈ ℝ. Positive weights required higher expression, whereas negative weights encoded markers expected to be low in the target program. The null maintained the same size ({m}_{s}=sum _{g}{mathbb{1}}(w{s,g}ne 0)) by drawing m_s unweighted competitors from ({{mathcal{P}}}_{s}), preserving the competitive interpretation. Observed signed sums used w{s,g}, whereas absolute-magnitude sums used |w{s,g}|.
We used B = 2,000 permutations per set (10,000 for final figures), exclude_set = True (competitive null), two-sided P when depletion was relevant and FDR control at 5%. For scRNA-seq, we recommend computing on log-normalized counts after library-size normalization and optional regression of technical covariates; for CyTOF, arcsinh or z-score scaled channels work well.
Machine-learning classification of cells into subpopulations
In each tumour, a training set of cells was constructed, including only cells that were successfully classified as luminal, basal-like or cycling, keeping class-distribution and size equal between samples. From each tumour, 80% of these cells were randomly assigned to the training set, and the remaining 20% were used as the validation set. We used an XGBoost model35, with a learning rate of 0.1, a maximum depth of 10 and 1,000 estimators. The model achieved a prediction accuracy of 94% on the validation set. The trained model was subsequently applied to cells that were not assigned to a subpopulation by DBSCAN (cluster –1), and cells predicted with >95% confidence were assigned to the corresponding luminal, basal-like or cycling subpopulation for downstream analyses (Extended Data Fig. 3b). The contribution of each feature to the XGBoost classification was evaluated using SHAP scores30,31, which reflect feature contribution to the classification rather than relative expression levels.
Vendi score to determine epigenetic diversity
Vendi scores96 were computed based on the epigenetic CyTOF panel (histone PTM and chromatin modifiers). For each sample, cells were stratified by class label. To control for differences in cell number across classes, we repeatedly subsampled m = ⌊n_min/2⌋ cells without replacement from each class, where n_min was the smallest class size in that sample. Marker intensities were first normalized using a global z-score computed across a balanced sample of cells from all datasets. For each rarefaction, epigenetic marker values were discretized into 20 uniform bins, and the normalized dual Vendi score was computed on the resulting cell-by-marker matrix. Reported values correspond to the mean across 5,000 rarefactions, with uncertainty intervals defined by the 2.5th and 97.5th percentiles of the rarefied score distribution.
K5-based sorting followed by proteomic, transcriptomic, CUT&Tag and EM-seq analyses
Cell staining, sorting and sample preparation
Sample preparation for mass spectrometry analysis was optimized to enable intracellular staining before FACS with limited input material. Mildly fixed (1.6% PFA) breast tumour single-cell suspensions prepared for CyTOF were thawed and washed with Maxpar CyTOF PBS. Cells were fixed and permeabilized using Maxpar nuclear antigen staining buffer set (201063, Standard BioTools) according to the manufacturer’s instructions. Staining was done in 10% FCS/CyTOF Nuclear Antigen Staining Perm with the following antibodies: K5–AF546 (Cell Signaling, 71536, in-house fluorophore conjugation) and pan-keratin–AF647 (Cell Signaling, 4528). Following three washes with PBS, cells were transferred to a new well, to minimize residual detergent content. Samples were read using FACS (BD Aria III), with 200 cells of each population (K5hi and K5low; Supplementary Fig. 12a) sorted directly into freshly prepared 3 μl lysis buffer-containing wells in a 96-well plate format (Eppendorf twin.tec PCR plates). With a sorter droplet volume of 3.33 nl, the sorting process contributed an additional 0.66 μl to the total volume per well.
The cell lysis buffer was prepared by combining 5 mM tris-(2-carboxyethyl) phosphine (TCEP) as a reducing agent, 20 mM chloroacetamide (CAA) alkylation agent, 100 mM triethylammonium bicarbonate (TEAB) and 0.1% n-dodecyl-β-D-maltoside (DDM). After sorting, the plate was briefly centrifuged to ensure cells settled into the lysis buffer. The plate was then sealed with PCR cap strips and incubated at 95 °C for 30 min in an Eppendorf ThermoMixer C, with the lid covered to prevent condensation. Following incubation, the plate was cooled, briefly centrifuged and 11 μl protein digestion buffer (50 mM ammonium bicarbonate buffer, 0.033 ng μl–1 sequencing grade modified trypsin (Promega) and 0.132 ng μl–1 Trypsin/Lys-C mix, mass spec grade (Promega)) was added to each well. The plate was resealed, briefly centrifuged and incubated overnight at room temperature for protein digestion. The next day, 20 μl solvent A (99.9% water and 0.1% formic acid) was added to each well to acidify the samples and halt the trypsinization process.
LC–MS analysis
LC–MS analyses were performed on an Evosep1 liquid chromatography system (Evosep) coupled to the TimsTOF SCP mass spectrometer (Bruker). The samples were loaded onto a disposable Evotip C18 trap column (Evosep Biosystems) according to the manufacturer’s instructions. In brief, the workflow involved rinsing dry Evotips with 20 μl solvent B (99.9% acetonitrile and 0.1% formic acid), followed by centrifugation at 800g for 60 s. The tips were then conditioned by soaking in 100 μl 1-propanol until they appeared pale white. After conditioning, the tips were equilibrated with 20 μl solvent A, followed by centrifugation at 800g for 60 s. The protein samples were loaded onto the wet tips, followed by another centrifugation step at 800g for 60 s. To ensure cleanliness, the tips were washed with 20 μl solvent A, with centrifugation repeated. Finally, to maintain tip hydration, 100 μl solvent A was added, and the tips were centrifuged briefly at 800g for 10 s.
Peptides were separated on an Aurora Elite CSI 15 × 75 C18 UHPLC column (IonOpticks) using the Whisper 40 SPD method. Mass spectrometric acquisition was performed in a data-independent (DIA) PASEF mode. For the diaPASEF mode, the ion accumulation and ramp time was set to 100 ms, and precursors in an ion mobility range from 1/K0 = 1.45 V s–1 cm–2 to 0.64 V s–1 cm–2 were analysed over a mass to charge (m/z) range from 100 to 1,700. Precursor ions for MS/MS analysis were isolated based on diaPASEF window placement covering an ion mobility range from 1/K0 = 0.75 V s–1 cm-2 to 1.2 V s–1 cm–2 and a m/z range of 400–1,000. The estimated cycle time was 0.64 s with 1 MS ramp and 5 MS/MS ramps, resulting in 75 MS/MS windows. The collision energy was ramped from 20 eV at 1/K0 = 0.6 V s–1 cm–2 to 59 eV at 1/K0 = 1.6 V s–1 cm–2.
Data analysis
DIA-NN (v.1.8.1) was used to analyse the mass spectrometric raw files97. Analyses of the files were performed using a library-based approach (spectral library provided by BRUKER containing 67,686 proteins and 13,827 genes). Library precursors were re-annotated using a FASTA database (FASTA files UP000000589_10090.fasta and UP000000589_10090_additional.fasta, version August 2022). Trypsin was selected as protease, with a maximum of one missed cleavage. DIA-NN default settings were used with the following exceptions: the charge range of precursors was set to 2–10, and the ‘unrelated runs’ option was selected. A total of 5,630 proteins were identified.
Functional enrichment analysis of differentially expressed proteins was done using the enricher function (clusterProfiler package98) comparing to MsigDB hallmark gene sets85.
H3K4me1 CUT&Tag on sorted populations
Single-cell suspensions of mildly fixed (1.6% PFA) cells derived from luminal PDX tumours or MCF7 cultures were stained as described above. For PDX samples, cells were stained with K5–AF555 (Cell Signaling, 72825) and pan-keratin–AF647 (Cell Signaling, 4528). Pan-keratin-positive epithelial cells were sorted on the basis of K5 expression levels into K5hi and K5low populations. For MCF7 cells, staining was performed using K5–AF555 and GATA3–Brilliant Violet (BioLegend, 653814). Cells expressing high K5 and low GATA3 were defined as K5hi and compared with the remaining cell population (K5low). Cells were sorted using a Sony SH800S cell sorter (Sony Biotechnology) with single-stain controls for compensation and to establish gating thresholds.
Following sorting, H3K4me1 profiling was performed using a CUT&Tag-IT Express Assay kit (Active Motif, 53175) according to the manufacturer’s instructions. The H3K4me1 antibody (Cell Signaling, 5326) was used at a 1:50 dilution. Decrosslinking was performed by incubation for 1 h at 55 °C followed by 4 h at 65 °C. Libraries were sequenced on an AVITI platform (Element Biosciences) using paired-end 50 bp reads. Sequencing data were demultiplexed and aligned to the hg38 assembly. Peaks were called using MACS2 with the –keep-dup 1 parameter. Peaks unique to either K5hi or K5low samples were assigned to genes using the ChIPseeker R package. Functional enrichment analysis was performed using the enricher function from the clusterProfiler R package, using gene signatures detailed in Supplementary Table 4.
EM-seq of sorted populations
EM-seq was adapted for low-input samples. Tumour single-cell suspensions were stained with K5 and pan-keratin antibodies as described above. In brief, 200 cells of each population (K5hi and K5low) were sorted directly into freshly prepared lysis buffer (10 mM Tris-HCl, pH 8.0, 200 mM NaCl, 10 mM EDTA, 0.5% SDS and 0.3 mg ml–1 proteinase K) and frozen. For each condition, four replicates were analysed.
Lysed cells were incubated at 55 °C for 3 h, followed by overnight incubation at 60 °C to reverse crosslinking. Tris-HCl and NaCl were added to reduce the SDS concentration to 0.33% before PCI extraction. The aqueous phase was recovered, NaCl was adjusted to 300 mM and glycogen added to 0.13 mg ml–1 following DNA precipitation with 2.3 volumes of ice-cold ethanol at −20 °C overnight. DNA was pelleted by centrifugation (21,000g, 45 min, 4 °C), washed once with 70% ethanol and resuspended in 10 mM Tris-HCl, 0.1 mM EDTA (pH 8.0).
DNA samples were enzymatically fragmented using a NEBNext UltraShear kit (M7634S, New England Biolabs) for 25 min at 37 °C. Libraries were prepared using a NEBNext Enzymatic Methyl-seq v.2 kit (E8015S, New England Biolabs) and NEBNext LV Unique Dual Index Primers Set 2A (E3390S, New England Biolabs) according to section 3 of the NEBNext UltraShear user manual, with the following modifications: unmethylated lambda and CpG methylated pUC19 DNA controls were diluted 1:500. Libraries for replicates three out of the four replicates were prepared with conversion controls. DNA denaturation before cytosine deamination was performed with formamide (4401457, Thermo Fisher Scientific). Libraries were amplified for 12 PCR cycles and purified by 2 rounds of bead cleanup with NEBNext Sample Purification Beads at 0.8× ratio. Library quality and fragment size distribution were assessed on an Agilent TapeStation with a High Sensitivity D5000 kit, which produced an average fragment size of about 500 bp.
Libraries were sequenced on AVITI high-output flow cells (Element Biosciences), which generated 150-bp paired-end reads.
Paired-end sequencing reads were subjected to adapter and quality trimming using cutadapt99 (v.4.4; parameters: –quality-cutoff 20 –overlap 5 –minimum-length 25; Illumina TruSeq adapter ‘AGATCGGAAGAGC’ clipped from both reads), followed by trimming of 10 and 5 nucleotides from the 5′ and 3′ end of the first read and 15 and 5 nucleotides from the 5′ and 3′ end of the second read. The trimmed reads were aligned to the human reference genome (hg19) using BSMAP100 (v.2.90; parameters: -v 0.1 -s 16 -q 20 -w 100 -S 1 -u -R). Duplicates were removed using the ‘MarkDuplicates’ command from GATK101 (v.4.6.2.0; –VALIDATION_STRINGENCY = LENIENT –REMOVE_DUPLICATES=true). Methylation rates were called using mcall from the MOABS package102 (v.1.3.9.6; default parameters). To assess similarity between sorted tumour populations, pairwise correlations of CpG methylation levels were calculated using only shared CpG present in all eight samples of a given tumour. Pearson’s correlation coefficients were calculated across these shared CpG sites.
Differential methylation analysis comparing K5hi and K5low cells was conducted for each tumour separately, with replicates pooled to obtain higher coverage. WGBStools (https://doi.org/10.26508/lsa.202503514) was used to identify differentially methylated regions, which were assigned to genes based on promoter overlap (–2,000 to +500 from the transcription start site (TSS)). For each gene, promoter-associated methylation changes were aggregated, and only genes with an absolute difference >0.2 and FDR-corrected Fisher’s exact test <0.05 were considered. Genes were classified according to the predominant direction of methylation change.
Functional enrichment analysis was performed using the enricher function (clusterProfiler package), comparing to MsigDB hallmark gene sets or curated breast cancer cell identity signatures.
Replicate-pooled EM-seq methylation profiles were summarized at the CGI level for each tumour and state combination by calculating CGI methylation as the ratio of methylated reads to total coverage. TCGA BRCA DNA-methylation data (Illumina HumanMethylation450) were mapped to hg19 CGI coordinates, and CGI methylation for each tumour was defined as the mean β value across probes overlapping the corresponding CGI. A shared CGI feature space was constructed as the intersection between CGIs detected in EM-seq and those measurable in TCGA. In each sample (tumour 5 or tumour 23), differential methylation between K5hi and K5low states was calculated for each CGI, and CGIs showing concordant direction of change across the two samples were retained. The effect size for each retained CGI was defined as the median of the model-specific differences and used to assign a signed weight. TCGA CGI methylation values were standardized across tumours, and for each tumour, a signature score was computed as the weighted mean of standardized CGI methylation values across the retained CGIs. Signature scores were compared across PAM50 subtypes.
Read-level DNA methylation heterogeneity was quantified using the RLM tool103. For each replicate, BSMAP-aligned paired-end BAM files were analysed against the hg19 reference genome using parameters -m PE, -a bsmap, and -s all. Only loci with sequencing coverage ≥10 reads were retained for analysis. Entropy values from all loci were aggregated for each sample and compared between the K5hi and K5low in each tumour sample.
RNA extraction and bulk MARS-seq
For bulk MARS-seq analysis, MCF7 cells were sorted into K5hiGATA3low and K5lowGATA3hi populations (as described above) to capture basal-like and extreme luminal subpopulations. Cells were dissociated using Accutase (Sigma-Aldrich, STC-07922) supplemented with DNase I (Merck, 4716728001), washed with PBS and viability assessment was conducted using Zombie Violet fixable viability dye (BioLegend, 423105 or 423113). Cells were incubated for 10 min on ice in the dark, followed by 2 washes with staining buffer (PBS containing 2% FBS and 2 mM EDTA). For intracellular staining, cells were fixed in 4% formaldehyde–PBS for 15 min at room temperature. The fixation reaction was quenched with glycine (final concentration 125 mM), and cells were centrifuged at 700g for 5 min at 4 °C, then washed once with ice-cold staining buffer and once with PBS. Cells were permeabilized with 0.1% Triton X-100 in PBS for 15 min at room temperature, washed twice with staining buffer, and blocked for 10 min on ice with blocking buffer (PBS containing 5% FBS and 2 mM EDTA). Cells were then stained with anti-GATA3-BV421 (1:10 dilution, BLG-653814) and anti-KRT5-Alexa Fluor 555 (1:20 dilution, CST-72825S) antibodies in staining buffer overnight at 4 °C protected from light, followed by two washes with sorting buffer. Flow cytometry was performed on a Sony SH800S Cell Sorter. Single viable cells were gated (Zombie dye exclusion). Intracellular GATA3 and KRT5 expression were quantified in viable cell populations using single-stain controls for compensation and to establish gating thresholds (Supplementary Fig. 12b).
Total RNA was extracted using a RNeasy Micro Kit (Qiagen, 74004) according to the manufacturer’s instructions and stored at −80 °C. Bulk MARS-seq libraries were prepared from extracted RNA following the published protocol104 and sequenced on a NextSeq 500 instrument using a NextSeq 500/550 High Output Kit v.2.5 (75 cycles). Differential expression analysis was conducted using UTAP transcriptome analysis pipeline105.
Flow cytometry sorting of CD74hi and CD74low MCF7 cells
MCF7 cells were dissociated using Accutase (Sigma-Aldrich, STC-07922) supplemented with DNase I (Merck, 4716728001) and counted in culture medium. Cells were washed with PBS and viability assessment was conducted using Zombie NIR or Zombie Violet fixable viability dye (BioLegend, 423105 or 423113). Cells were incubated for 10 min on ice in the dark, followed by two washes with staining buffer (PBS containing 2% FBS and 2 mM EDTA). For surface marker staining, cells were incubated with anti-human CD74–FITC antibody (1:10 dilution in staining buffer; eBioscience, 11-0748-42, clone 5-329) for 45 min at 4 °C in the dark with intermittent mixing every 10 min, then washed twice with sorting buffer (PBS containing 1% FBS and 5 mM EDTA). Viable cells were sorted into collection medium containing 50% FBS and 50% DMEM supplemented with 1% penicillin–streptomycin. To enrich for cells of the basal-like population, the top 10% of cells with the highest CD74 expression (CD74hi) and, as a control, the bottom 10% of cells with the lowest CD74 expression (CD74low) were sorted based on CD74–FITC fluorescence intensity (Supplementary Fig. 12c). Cells were sorted using a Sony SH800S cell sorter (Sony Biotechnology) with single-stain controls for compensation and to establish gating thresholds.
Migration assay
Transwell assay
Cell migration capacity was assessed using Transwell polycarbonate membrane inserts (6.5 mm diameter, 8.0 µm pore size; Corning, 3422) placed in 24-well plates. Sorted cells were seeded in complete culture medium and allowed to recover for approximately 20 h. Cells were then serum-starved in DMEM supplemented with 0.1% FBS for 5 h before the assay. Following serum starvation, cells were dissociated using Accutase, resuspended in DMEM with 0.1% FBS and counted. A total of 5 × 10⁴ cells in 150 µl DMEM with 0.1% FBS were seeded into the upper chamber. The lower chamber was filled with 600 µl of medium containing 20% FBS and 100 ng ml–1 epidermal growth factor (EGF; PeproTech, AF-100-15) as a chemoattractant. Control wells contained DMEM with 0.1% FBS in both chambers to assess random migration.
Following a 20-h migration period, non-migrated cells on the top surface of the membrane were removed with a cotton swab, and migrated cells on the bottom surface were fixed with 4% formaldehyde (Thermo Fisher Scientific, 28906) for 15 min at room temperature and stained with 0.1% crystal violet (Sigma-Aldrich, C0775) in 20% methanol for 10 min. Membranes were washed with distilled water and air-dried. Owing to weak crystal violet signal intensity and high background noise that precluded accurate automated quantification, migrated cells were imaged using the Cy5 channel (excitation and emission of 640 and 670 nm, respectively) to detect crystal violet autofluorescence. This approach enabled reliable background subtraction and automated cell counting. The Cy5 signal showed complete overlap with crystal-violet-positive cells, thereby confirming that autofluorescence accurately represented the migrated cell population.
Quantification was performed using ImageJ software (v.1.53; National Institutes of Health), and results are expressed as the number of migrated cells per field.
Wound-healing assay
Collective cell migration and wound closure were assessed using a two-dimensional wound-healing assay. Culture-Inserts 2 Well for self-insertion (ibidi, 80209) were placed in 6-well plates (Corning, CC-3516) under sterile conditions. Cells were seeded at 1 × 10⁵ cells per well in 70 µl of complete growth medium and incubated for 24 h until a confluent monolayer formed. Culture inserts were carefully removed with sterile tweezers to create a defined cell-free gap of approximately 500 µm width. Wells were washed twice with PBS to remove non-adherent cells, and 2 ml of fresh medium was added. Images were acquired at 0 h, 20 h, 46 h and 54 h after wounding at ×10 magnification using an inverted microscope.
Wound areas were quantified from bright-field images using an interactive segmentation workflow based on the Segment Anything Model (SAM). For each image, the wound region was identified as the continuous cell-free area and segmented using user-guided point prompts placed in the wound and, when required, outside the wound to suppress surrounding tissue or background. The resulting binary mask was visually inspected and refined interactively until it matched the wound boundary. The wound area was then calculated as the number of pixels contained in the final mask. To account for differences in image size or field of view, the fractional wound area was computed for each image by dividing the wound-mask area by the total image area. When spatial calibration was available, pixel areas were converted to physical units (µm2) using the microscope pixel size.
This procedure yielded both absolute and normalized wound-area measurements for comparison across experimental conditions.
WGBS of breast tumour samples
Sample processing, bisulfite reaction and sequencing
Mildly fixed breast tumour single-cell suspensions prepared for CyTOF were thawed and DNA was extracted using a NucleoSpin Tissue kit. RNA was removed by the addition of 20 μl of 10 mg ml–1 RNase during the lysis step. The generation of dual-indexed libraries WGBS followed a modified protocol based on the NEBNext Ultra DNA Library Prep kit for Illumina (New England BioLabs, E7442, E7445 and E7535), in accordance with the manufacturer’s instructions. The library input was 500 ng gDNA, quantified using a Qubit BR assay (Invitrogen, Q32853), and 1% unmethylated Lambda DNA (Promega, D1521) was added as a control for bisulfite conversion efficiency. Fragmentation of input gDNA to achieve an average insert size of 350 bp was done with a Covaris S220 Focused-ultrasonicator. Size selection was performed using SPRIselect beads, isolating fragments in the 300–400 bp range.
Bisulfite conversion after size selection was done using an EZ DNA Methylation-Lightning kit (Zymo, D5030), following the manufacturer’s guidelines. For amplification after bisulfite conversion, Kapa HiFi Uracil+ (Kapa Biosystems, KK282) polymerase was used under the following cycling conditions: 98 °C for 45 s, followed by 8 cycles of 98 °C for 15 s, 65 °C for 30 s, and 72 °C for 30 s, with a final extension step at 72 °C for 1 min. WGBS libraries were sequenced on an Illumina NovaSeq 6000 instrument using an S4 flowcell and a 150 bp paired-end dual indexed run, with 5% PhiX library control (Illumina). The resulting coverage ranged from 16.7× to 22.5×. The bisulfite conversion rate for unmethylated Lambda DNA averaged 99.8%.
WGBS data analysis
Paired-end sequencing reads were pre-processed with Trim Galore! (v.0.6.5) before alignment with Bismark (v.0.24.2) and Bowtie2 (v.2.3.5.1)106 using the ‘non_directional’ option. A reference genome was generated for bisulfite-converted human hg19 (obtained from UCSC). The resulting alignment files were merged and sorted using Samtools (v.1.16.1) and further deduplicated with ‘deduplicate_bismark’, before calling of context-dependent methylation with ‘bismark_methylation_extractor’.
Empirical entropy was calculated from read-level methylation patterns using ClubCpG package55. Read clustering of methylation patterns over 100 bp genomic bins was used to determine the observed empirical distribution of DNA methylation states, without imputation for reads that did not fully cover a given bin. As there is no reference methylation pattern for individual cell types in this dataset, we used an empirical entropy estimate to gauge the degree of cell type heterogeneity in each sample, using as the individual pattern probabilities the proportion of reads with that state, and normalizing Plog(P) over 2n, where n is the number of CpGs in the bin. Each bin was assigned a normalized entropy score. Genomic bins were associated with genes (±3 kb from the TSS) using ChIPseeker package107. A list of CGIs was downloaded from the UCSC table browser108 and bedtools intersect function was used to associate with genes (–1,000 bp from TSS – TES (transcription end site), n = 28,170)109. The average entropy was calculated for each CGI, and the functional enrichment for the associated genes was calculated using the enricher function (clusterProfiler package98) comparing with MsigDB genes sets85.
To deconvolute the DNA methylation data compared with the TCGA BRCA dataset51, the methylation status was calculated for each probe in the HumanMethylation450 array (Illumina) using the HumanMethylation450 v.1.2 Manifest File (https://emea.support.illumina.com/downloads/humanmethylation450_15017482_v1-2_product_files.html). The combined dataset (TCGA and this study) was then deconvoluted to different numbers of archetypes using the EDec package (https://github.com/BRL-BCM/EDec)110. The PAM50 information in the TCGA BRCA dataset was used to annotate tumours by subtype. The associated expression data available for the TCGA BRCA dataset were used to correlate expression patterns with each archetype. Genes were ranked according to the Pearson’s correlation coefficient for each archetype, which enabled us to associate each archetype with functional terms using GSEA and the MSigDB Hallmarks gene sets85,111,112.
Analysis of single-cell multiome datasets
Simultaneous profiling of chromatin accessibility and gene expression was performed using the Chromium Next GEM Single Cell Multiome ATAC + Gene Expression platform (10x Genomics) following the manufacturer’s protocol. Cryopreserved breast cancer cells were rapidly thawed, gradually diluted in RPMI supplemented with 10% FBS, washed in PBS containing 0.04% BSA and filtered through a 40 μm strainer. Nuclei were isolated using the 10x Genomics nuclei isolation workflow, washed in chilled nucleus wash buffer and resuspended in diluted nucleus buffer. Nucleus suspensions were filtered to remove aggregates and adjusted to the recommended concentration before loading. Approximately 500 nuclei per sample were loaded onto a Chromium controller for tagmentation, barcoding and GEM generation. Gene expression and ATAC libraries were generated according to the manufacturer’s protocol and indexed using 10x Genomics dual-index plates. Library quality and concentration were assessed using Qubit fluorometry and an Agilent TapeStation.
Sequencing was performed on an Aviti platform according to 10x Genomics specifications. ATAC–seq data were processed with cellranger-arc (v.2.2.0) and mapped against human genome GRCh38. Gene expression data were processed using cellranger (v.10.0.0).
Previously published scRNA-seq and scATAC–seq data13 were analysed as described by the authors. Only cells annotated as cancer cells, as defined by RNA profiles, were included in the analysis. To visualize gene expression pattern, UCell scores for the indicated signatures were calculated. To account for dropout, the gene signatures were smoothed using a Gaussian kernel with a bandwidth set to the 5th percentile of the Euclidean distance of the point-to-point distances in the normalized gene space. For the basal–luminal index, the z-score difference between the down in luminal versus basal and the up in luminal versus basal signatures59 was computed. For the ATAC–seq data, peaks were called for each sample (only cancer cells) separately, and the WIP fraction was calculated. A lower WIP fraction, corresponding to a greater proportion of fragments outside called peaks, was interpreted as increased epigenetic noise58.
snCUT&Tag profiling of H3K4 and H3K9 methylation in breast tumours
Sample preparation
Following CD45 depletion, 1 × 10⁶ cells were resuspended in antibody buffer (20 mM HEPES pH 7.5, 150 mM NaCl, 2 mM EDTA, 0.5 mM spermidine, 0.05% digitonin, 0.01% NP-40, protease inhibitors and 1% BSA), incubated on ice for 3 min and centrifuged for 3 min at 600g to extract nuclei as previously described113. Nuclei were resuspended in antibody buffer supplemented with 10% DMSO and cryopreserved for further analysis.
For CUT&Tag, all washes were made with 500 µl unless otherwise stated and all centrifugations were done using a swinging bucket centrifuge at 600g for 8 min at 4 °C. Around 50,000 to 100,000 nuclei were resuspended in 50 μl antibody buffer (EDTA 2 mM, 20 mM HEPES pH 7.2, NaCl 150 mM, spermidine 0.5 mM, BSA 2%, NP-40 0.01%, digitonin 0.01% and proteases inhibitor 1×) with 1:50 antibody dilution (anti-H3K4me1 D1A9, 5326 and anti-H3K4me3 C42D8, 9751, Cell Signaling) or 0.3 μg (anti-H3K9me2 D85B4 80806, Cell Signaling) and incubated overnight at 4 °C with rotation. Nuclei were washed the next day with Dig-Wash buffer and resuspended in 100 μl Dig-300 buffer (20 mM HEPES pH 7.2, 300 mM NaCl, 0.5 mM spermidine, 2% BSA, 0.01% NP-40 and 0.01% digitonin) together with protein A–Tn5 fusion (Diagenode, C01070001, 1:250) and incubated for 1 h at room temperature with rotation. Nuclei were washed 3 times with Dig-300 buffer, resuspended in 300 µl Tag-Buffer (20 mM HEPES pH 7.2, 300 mM NaCl, 0.5 mM spermidine, 2% BSA, 0.01% NP-40, 0.01% digitonin and 10 mM MgCl2) and incubated for 1 h at 37 °C. Tagmentation was stopped by addition of one volume of 1x diluted nuclei buffer (DNB, 10x Genomics) supplemented with 2% BSA and 12.5 mM EDTA. The nuclei were then centrifuged at 1,300g for 4 min at 4 °C and washed twice with 200 µl 1× DNB supplemented with 2% BSA. The nuclei were resuspended in 10–70 µl of DNB + 2% BSA. Nuclei were loaded on a 10x Chromium system using a 10X Chromium Single Cell ATAC–Seq kit v.2 (10x Genomics) as previously described113. GEM incubation, barcoding and amplification was performed according to the Chromium Single Cell ATAC Library kit manual with 17 PCR cycles. Libraries were amplified with 13 PCR cycles. snCUT&Tag libraries were sequenced on a NovaSeq 6000 (Illumina) in PE50 mode.
snCUT&Tag data analysis
Raw sequencing files (Fastq files) were processed using an in-house pipeline (https://github.com/vallotlab/scCUT-Tag_10X) to generate fragment files and to count matrices. In brief, the barcodes are aligned to indexed reference libraries using Bowtie2 (v.2.5.4) and the genomic parts of the reads are aligned to the human reference genome (hg38) using STAR (v.2.7.8a). Duplicate reads, reads mapping to the ENCODE blacklisted regions and reads with low mapping quality (q20) were filtered out.
Next, 50-kb bin matrices were used to generate a joint UMAP representation of all three tumours samples. Tumour microenvironment and tumour cells were annotated based on H3K4me1 or H3K4me3 enrichment at known marker genes (Supplementary Table 7). Owing to the physical removal of CD45+ cells during tumour dissociation, no immune cells could be identified based on H3K4me1 or H3K4me3 profiles. Peaks were called using CallPeaks (Signac)114. Gene activity matrices were generated by aggregating counts across gene bodies and promoter regions extending (–2 kb from the TSS), following the standard Signac approach. These gene-level activity scores were used as features for dimensionality reduction and clustering. Count datasets were normalized using SCTransform115 for each tumour separately. Differential binding occupancies were calculated by two-sided Wilcoxon signed-rank test (FDR-corrected). Functional enrichment was conducted using the enricher function (clusterProfiler package98), with MsigDB gene sets85,116 as references. Epigenomic gene signature scores were computed using UCell117 for each gene set of interest, starting from SCTransform counts. For visualization of gene signatures in UMAP space, to account for dropout, epigenomic gene signature scores were smoothed using a Gaussian kernel with a bandwidth set to the 5th percentile of the Euclidean distance of the point to point distances in the normalized gene space.
To identify loci that contribute to epigenomic intratumour heterogeneity (either H3K4me3 or H3K4me1), the SHAP algorithm was used on a trained XGBoost classifier35. For each tumour, the most contributing genes that led to accurate classification (around 400 genes, about 90% accuracy) were compared against gene signatures from MSigDB85,116.
Pseudo-bulk coverage tracks were generated by aggregating fragment-level snCUT&Tag data from cells assigned to each cluster. For each sample and histone mark, fragments corresponding to the basal-like cluster and to all remaining clusters were pooled separately. To enable direct comparison, the non-basal-like group was downsampled to match the total fragment count of the basal-like population. Genome-wide coverage was computed from fragment intervals and normalized to counts per million (CPM), producing bedGraph files that were subsequently converted to bigWig format for visualization. Tracks were visualized using pyGenomeTracks.
Pseudobulk chromatin profiles were generated from single-cell data and used for peak calling with MACS3 (ref. 118), with narrow peak mode applied to H3K4me3 and broad peak mode to H3K4me1. Unified peak sets for each sample and histone modification were annotated using ChIPseeker107, and genomic feature distributions were summarized as percentages of total peaks per sample, with promoter subcategories merged before visualization. Differential association of peaks to clusters was evaluated in a one-versus-rest framework. For each peak, signal presence was binarized and detection fractions were compared between the target population (cluster) and remaining cells using a one-sided two-proportion z-test. Effect sizes were computed as log2 fold change of CPM-normalized mean signal. P values were adjusted using the Benjamini–Hochberg procedure, and peaks were considered significant at adjusted P ≤ 0.05, log2 fold change ≥ 0.25, and a minimum detection rate of 1%.
Motif enrichment analysis was performed using the Signac framework114 with transcription factor binding profiles obtained from the JASPAR database119. Motifs associated with a pre-defined list of EMT and basal-like state regulators, defined separately for enhancer (H3K4me1) and promoter (H3K4me3) signals, were examined, using a nominal significance threshold of P < 0.05. Multiple testing correction was computed using the Benjamini–Hochberg procedure in the subset of tested transcription factors per sample, which reflect the reduced hypothesis space.
To compare the read count with gene activity, for each tumour the number of counts per cell (‘nCount_RNA’) per cell was correlated (Pearson’s) with the epigenomic gene signature score (UCell computed on TFIDF normalized115 data).
Using scGLUE120, we performed multimodal integration of the H3K4me1 snCUT&Tag dataset with the CyTOF dataset. For each of the cell-identity markers present in the CyTOF antibody panel, we identified the relevant gene in the gene activity matrix and used those to form the weakly informative connection for scGLUE. After running scGLUE, we trained an XGBoost classifier on the CyTOF data in the joint latent space to predict the cell label and used the classifier to perform label transfer to the snCUT&Tag modality.
For cell annotation of the H3K9me2 dataset, the complementary H3K4me1 dataset from the same nucleus extraction was used. In brief, 20-kb bin matrices were generated for both H3K4me1 and H3K9me2 datasets, keeping cell labels derived from the H3K4me1 analysis. A classifier was trained on the labelled H3K4me1 dataset, which achieved >95% accuracy, and applied to the inverted z-score matrix of H3K9me2, using the generally opposing genomic distributions of H3K4me1-associated regulatory chromatin and H3K9me2-associated repressive chromatin as an inference framework62,63.
For gene association analysis, H3K9me2 was analysed without peak calling, as this mark forms broad repressive domains rather than sharp focal peaks. Instead, promoter regions (–2 kb to +200 bp relative to the TSS) were tiled into 200 bp windows, and fragment counts were quantified across these promoter-proximal tiles to generate a promoter occupancy matrix. The resulting matrix was normalized using SCTransform115 and used for UMAP embedding and clustering. Because H3K9me2 is a repressive histone mark, high gene-set scores were interpreted as increased repressive occupancy over the corresponding loci rather than increased transcriptional activity.
Plasma collection and EPINUC analysis
Blood samples were collected in EDTA tubes and transferred ambient for processing. Plasma was separated by centrifugation and stored at −80 °C.
Surface preparation for single-molecule imaging
PEGylated-biotin-coated and PEGylated-poly(T)-coated microscope slides were prepared as previously described28,29. In brief, glass coverslips were cleaned extensively (sonication rounds with acetone and Alconox), hydroxylated by incubation in 1 M KOH and passivated with amino-silanization chemistry (3% 3-aminopropyltriethoxysilane, 5% acetic acid in HPLC ethanol). Surface functionalization along with the first passivation step was performed by applying mPEG: PEGylated-biotin/PEG-azide solution (10:1 ratio). PEGylated surfaces were further passivated with MS(PEG)4. Anchoring of dT50 to PEGylated-poly(T) surfaces was done via click chemistry (10 µM 5′heyxynyl-dT50 (IDT), 2 mM CuSO4).
EPINUC antibody labelling
Antibodies were labelled using a biotin conjugation kit (Abcam, ab201796) and Alexa Flour antibody-labelling kits (Thermo Fisher Scientific, A20181, A20183 and A20186) according to the manufacturer’s protocol. Labelled antibodies were further purified by size-exclusion chromatography using Bio-Spin 6 columns (Bio-Rad, 7326200). Antibodies are listed in Supplementary Table 5a.
Single-molecule imaging of biomarkers
Quantification of the five protein biomarkers was conducted as previously described28. PEGylated-poly(T)-coated coverslips were assembled into a ChipSop flowcell (chip 2-28 mini Luer platform Fl. 342, 30001180), which generated a 14-lane flowcell. Streptavidin solution (0.2 mg ml–1 in PBS) was added to the surface for 15 min and washed with IMB2 (10 mM MES pH 6.5, 60 mM KCl, 0.32 mM EDTA, 3 mM MgCl2, 10% glycerol, 0.1 mg ml–1 BSA and 0.02% Igepal). Biotinylated antibodies were incubated on the surface in IMB2 for 30 min, followed by washing with IMB2. Next, the plasma sample was added to the flowcell and incubated on the surface for 30 min, followed by three washes with IMB2 to allow binding of target proteins. Fluorescently labelled antibodies (detection antibodies) were introduced to the surface for 60 min, washed with IMB2 and imaged.
Imaging was performed on a TIRF microscope manufactured by Nikon (Eclipse Ti2-E LU-N4 TIRF) with a CFI apochromat TIRF ×60 objective lens and TRF49904, TRF49909 and TRF89902 filter cubes (Chroma) for the 488 mm, 561 mm and 647 nm lasers, respectively. Images were taken with the ×1.5 magnification setting, which resulted in fields of view (FOVs) of 148 µm × 148 µm using an Andor Zyla 4.2 Plus camera. At least 50 FOVs were imaged per lane.
Single-molecule imaging of cell-free nucleosomes histone PTMs
PEGylated-poly(T)-coated coverslips were assembled into an Ibidi flowcell (Sticky Slide VI hydrophobic, IBIDI), generating a 6-lane flowcell and further passivated with 5% BSA for at least 30 min.
Plasma nucleosomes were processed as previously described28 with minor modifications. Nucleosomes were polyA tailed by the following reaction: 20 µl plasma was mixed with 10 µl of 10× Green buffer (Enzymatics), 416 µM CoCl2 (Enzymatics), 1:60 protease inhibitor cocktail (Sigma), 83.3 µM dATP (Thermo Fisher Scientific), 5 µl Klenow Fragment (3′→5′ exo-, NEB), 3 µl T4 polynucleotide kinase (NEB) and 4 µl terminal deoxynucleotidyl transferase (TdT, Enzymatics). Following incubation at 37 °C for 1 h, TdT in the samples was inactivated by the addition of EDTA at final concentration of 5 mM.
Next, plasma samples containing polyA-tailed cell-free nucleosomes were incubated with antibodies (final concentration 1:60) for 30 min at room temperature to allow for the formation of antibody–cell-free nucleosome complexes. Next, samples were loaded on the surface and incubated for 15 min to allow hybridization of polyA tails to dT50 oligonucleotides. The flowcell was washed once with IMB (12 mM HEPES pH 8 (Thermo Fisher Scientific), 40 mM Tris pH 7.5 (Gibco), 60 mM KCl (Sigma), 0.32 mM EDTA (Invitrogen), 3 mM MgCl2 (Sigma), 10% glycerol (Bio-Lab), 0.1 mg ml–1 BSA (Sigma) and 0.02% Igepal (Sigma)), and cell-free nucleosomes were visualized by hybridizing 25 pM Cy3-dT23 in IMB to the free portion of polyA tails for 10 min. We supplemented Cy3-dT23 solution with TetraSpeck beads (Thermo Fisher Scientific), used as fiducial markers to allow correction for stage drift in image analysis.
The flowcell was washed once with IMB, then filled with IMB, followed by time-lapse imaging of 5 cycles every 15 min with the 3 laser channels across all positions.
Imaging was performed on a TIRF microscope as described above obtaining 100 FOV (148 µm2) images per lane or on a high-throughput single-molecule imaging system at Epivision obtaining 100 FOVs (200 µm2) images per lane. The focus was maintained throughout the run using IR-assisted autofocus system.
Single-molecule image analysis
Image analysis was performed with the open-source software CellProfiler (v.3.1.9; http://www.cellprofiler.org/) as previously described28. In brief, time-lapse images of antibody-binding events and TetraSpeck beads were aligned, stacked and summed to one image. Antibody spots can be differentiated from TetraSpeck bead spots based on spot size and intensity. Summed antibody images were aligned with cell-free nucleosome images to count colocalization events. For biomarkers analysis, antibody binding events were quantified. To minimize the surface batch effects, signals were normalized to the surface activity (average antibody signal across all lanes of the surface).
EPINUC sample classification and feature scoring
PPS analysis on the data was conducted using a previously published algorithm (https://github.com/8080labs/ppscore). In brief, by calculating a cross-validated decision tree (repeated (10,000) 4-fold cross-validation) for the target variable (for example, diagnosis) using only one of the markers, it is possible to determine which of the markers in the datasets contributes most to the target variable.
XGBoost classifier was applied to the data, using all features measured and their combinations. Feature contribution was assessed by SHAP.
For ROC curves, for each classification task, the most important features were selected using the Boruta algorithm (with a random forest classifier)121. An additional feature engineering step was used to generate combinatorial combinations (multiplication, division and SQRT) of the selected features, and another round of feature selection was performed using Boruta. The final features selected were used either in a random forest classifier or in a soft voting classifier consisting of RF, XGBoost and LDA classifiers. The final classifier was used to generate a ROC curve with the associated confidence intervals using 10-fold cross-validation and 1,000 bootstrap repeats.
To enable comparison across independently processed EPINUC cohorts, batch correction was applied to account for differences in antibody labelling degree. In brief, the reference dataset was subsampled to balance group sizes, and feature-wise means and standard deviations were calculated. The independently processed cohort was first standardized and subsequently rescaled to match the mean and variance of the reference dataset. This approach allowed alignment of feature distributions across cohorts while preserving relative differences between samples.
Histone PTMs quantification by mass spectrometry
Histones were enriched from FFPE tissues as previously described122. Approximately 4 µg of histone octamer was mixed with an equal amount of heavy-isotope labelled histones, which were used as an internal standard123, and separated on a 17% SDS–PAGE gel. Histone bands were excised, chemically acylated with deuterated acetic anhydride and in-gel digested with trypsin124. The samples were separated by reversed-phase chromatography, acquired on a Q Exactive HF instrument (Thermo Fisher Scientific), and analysed using MaxQuant and QualBrowser, as previously described124. For each histone modified peptide, a percentage relative abundance (%RA) value for the sample (light channel) or the internal standard (heavy channel) was estimated. Light to heavy ratios (log2 transformed) of %RA were then calculated and are reported in Supplementary Table 8.
Reporting summary
Further information on research design is available in the Nature Portfolio Reporting Summary linked to this article.
نشر لأول مرة على: www.nature.com
تاريخ النشر: 2026-11-11 03:00:00
الكاتب: Noa Furth
تنويه من موقع “wakalanews”:
تم جلب هذا المحتوى بشكل آلي من المصدر:
www.nature.com
بتاريخ: 2026-11-11 03:00:00.
الآراء والمعلومات الواردة في هذا المقال لا تعبر بالضرورة عن رأي موقع “wakalanews”، والمسؤولية الكاملة تقع على عاتق المصدر الأصلي.
ملاحظة: قد يتم استخدام الترجمة الآلية في بعض الأحيان لتوفير هذا المحتوى.